Example One
Note the position of the Table heading
Table 7.1 Hourly Simulated Average Daylight Factor on 1st January
Example Two
Note the position of the Figure heading
Figure 7.1. Simulated Average Daylight Factor on 1st Jan at Vertical Obstruction Angle of 71.5o
Example One
Note the addition of extra information on the right of the figure.
Excel allows users to specify properties for scrolling sensitivity, including both vertical and horizontal scrolling sensitivity (Figure 6-42).
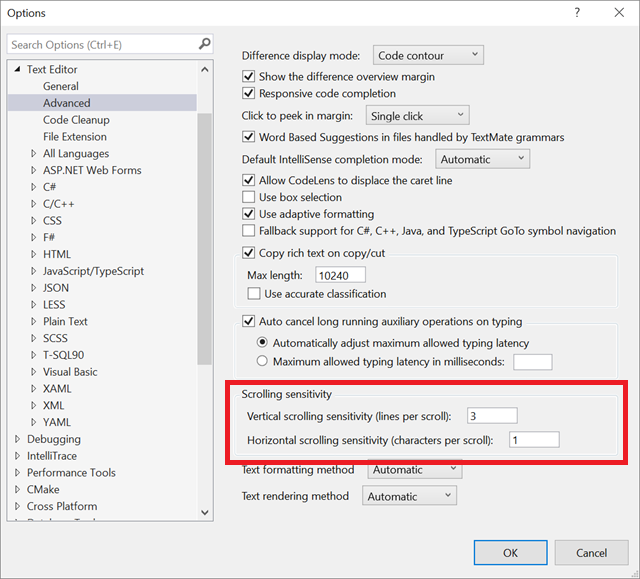
Figure 6-42. Scrolling Sensitivity in Excel
Example Two
Note the additional information given below the table to explain the meaning of the letters as well as some additional explanatory information.
Table 5.2 Capacity table of model AN25FV1+Av25FV1 (Room Y107, Block Y)
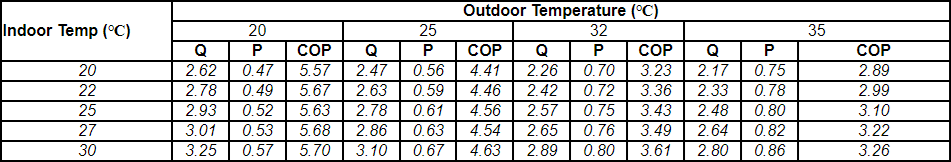
Symbols:
Q - Total cooling capacity (kW)
P - Power input (kW) (Comp + indoor + outdoor fan motor)
Notes:
The above capacity data is based on the following conditions
The corresponding refrigerant pipe length is equivalent to 5m.
Level difference between the indoor and outdoor unit is zero.