Guidelines for Presenting and Discussing Graphics
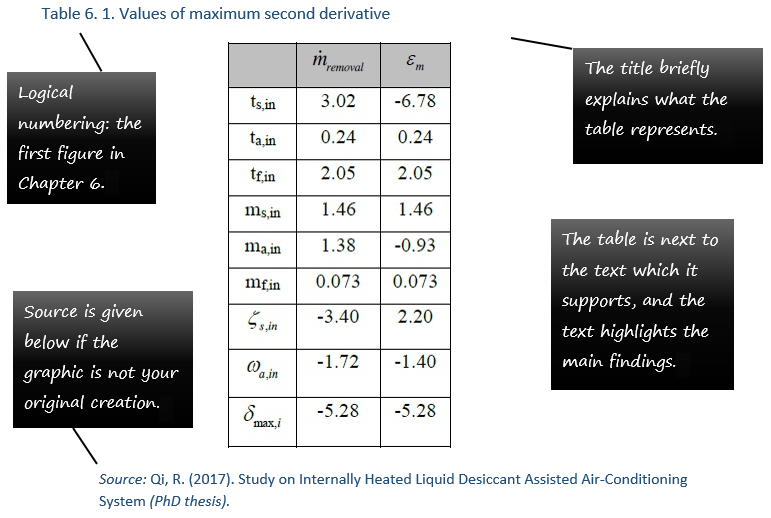
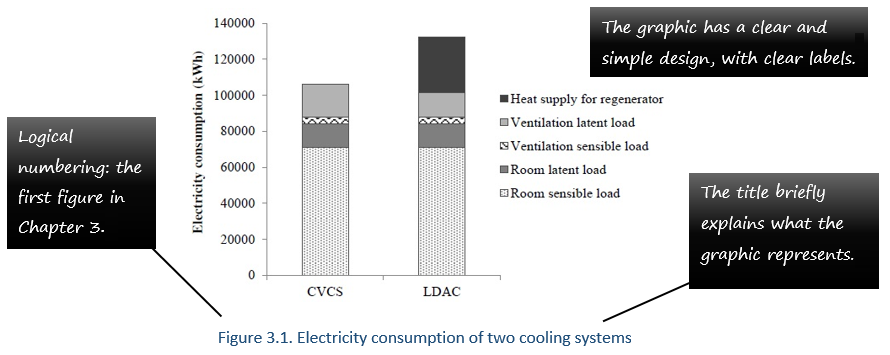
The two common types of graphics are tables, which are used for data, and figures, which are used for diagrams, screenshots, photos, drawings, charts and graphs. If you did not create the graphic yourself, you must credit the source under the graphic and you must refer to the graphic at least once in the neighbouring text. Do not use graphics to replace text; they should be used to support ideas in the text close to the graphic. It is often necessary to say where the graphic is, i.e. above or below.
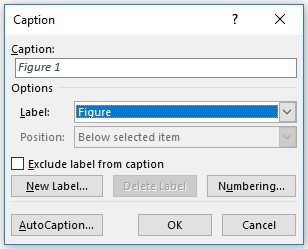
You can use Microsoft Word to add captions to your graphics. Type “captions” into the help box, click on “insert captions” and a new window opens. Figure 1-1 below shows the caption window.

Figure 1-1. Insert caption window in Microsoft Word
Language Advice
Graphic titles are usually written without articles (a, an, the) and as a noun phrase (a phrase that acts like a noun, e.g. correct use of nouns). Each word can be written with a capital letter but prepositions (e.g. of, on, at) are always in lower case. Alternatively, only the first word can be capitalised, as the examples below show.
To describe the graphic in the text, the most common phrase is “Figure 2.3 shows…” The verb is in present simple tense because the idea is a truth. Alternative verbs are: represents, illustrates, highlights, reveals, describes, or depicts. It is also possible to use these verbs passively, for example, “As depicted in Figure 2.2.1 above, the interferometer is…”
Using tables: The title is above the table.

Using figures: The title is below the figure.
